The following values of farm machines and tools comes from Five Acres and Independence by M. G. Kains. Five Acres and Independence is also available to purchase in print.
Values of Farm Machines and Tools*
[*Quarterly Bulletin, Michigan Experiment Station, Vol. XIII, No. 4.]
The value of an implement, tool, or machine may be found by using the original cost, estimating the life of the machine and the probable residual junk value. Each machine, tool or implement depreciates at a different rate. Depreciation also depends upon the care given and the repairs made. Hence it is impossible to state what rate should be applied in any specific case. However, Tables 19 and 20 and the graph shown in Figure 10-A may help in estimating depreciation for various types of equipment. For general inventory uses a uniform rate of 10% will answer perhaps as well as anything. It is an easy rate to work with. Where greater accuracy is necessary, tables that apply to each machine should be used. These may be obtained through the manufacturers or other organizations interested in each kind.
Table 19
Average Length of Life of Farm Implements
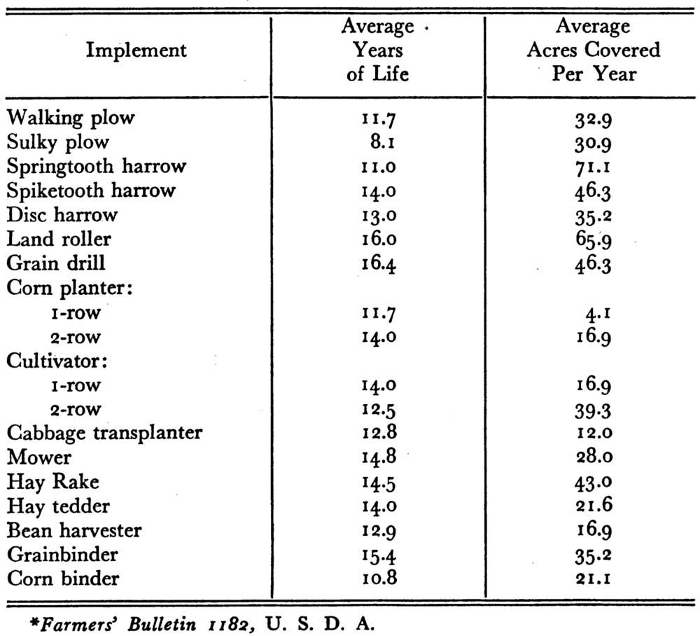
Most machines (“assets”) depreciate or become obsolete. Obsolescence arrives when a machine is out of date or a more effective new type is introduced. The average life of most farm implements is shown in Table 19. Depreciation applies to decrease in value due to wear and tear. It is usually a more important factor than obsolescence. Hence attention is centered on it, but assets should also be reduced in value proportionately as they become obsolete.
Table 20
Straight Line Method of Calculating Depreciation
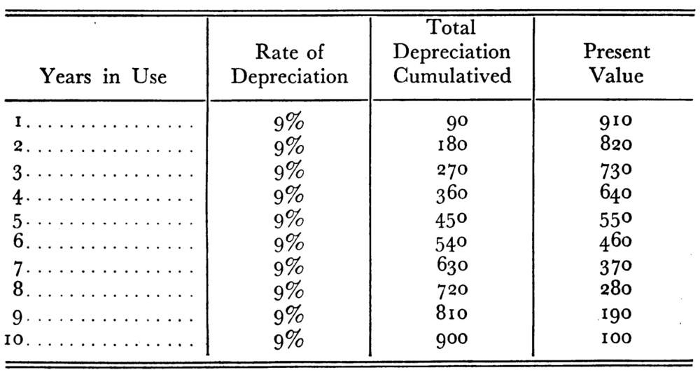
Of various methods of calculating, the “Straight Line” (Table 20) is probably the simplest. By it the rate of depreciation is determined by dividing the “total depreciation” by the estimated life of the asset. Total depreciation is obtained by subtracting the junk value from the original cost. If the original cost is $1,000, the estimated life 10 years and the junk value $100, the total depreciation would be $900 and the rate of depreciation 9% per annum. Hence the value of the asset at the end of the first year would be $910, at the end of the second, $820, and so on.
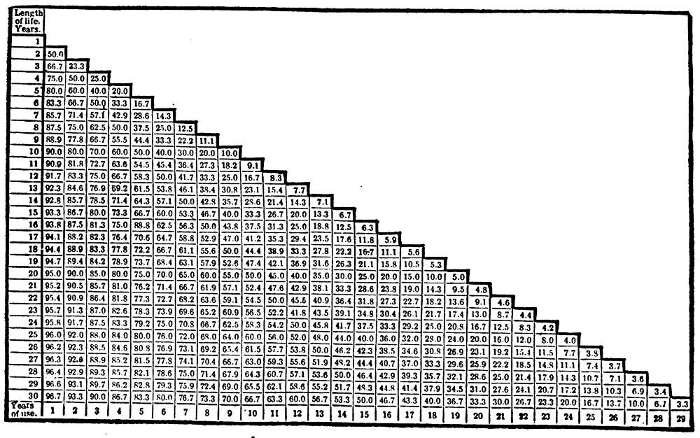
In general, the useful life of farm implements is governed by such factors as design, quality, construction, climate, soil, topography, use, and character of maintenance. In every case it is necessary to consider each factor in appraising. Exact rules are impossible.
Figure 10-A will be useful in estimating implement values. To use it find the probable length of life figure in the left hand column, then on the bottom line, the number of years used. Where the line of figures meets the column above the “years used” figure will be the per cent of original cost. For instance, to find the present value of a $10 machine whose probable life is 15 years but which has been used 7 years, find 15 in the left-hand column and 7 in the bottom row, follow the line and the column of figures to where they meet at 53.3. This signifies that the value of the implement at the time is 5.33% of its original cost; namely, $5.33.
When accurate cost figures on repairs are known, the value of machines or tools can be indicated as follows: A machine that costs $1,000 and which has an estimated life of 10 years represents a yearly overhead cost of $193. This figure is found in the graph (Fig. 11-A.) by locating in the left margin the value of $1,000 initial investment, tracing the dotted line horizontally from this point until it reaches the oblique “life line,” then following the vertical dotted line to the base line where the yearly overhead cost will be found; namely, $193. This cost includes the amount of estimated repairs (4% of the initial investment). Therefore, $193 minus $40. (4% of $1,000 initial cost of machine) equals $153 yearly overhead cost, less the estimated repairs. Hence, $153 plus the actual repairs for any one year equals the total yearly overhead cost.
Most farm machinery costs less than $200: tools only a few dollars—often only cents. To interpret overhead costs accurately from the graph on machines costing less than $200 multiply the initial cost by 10 and follow the chart. With a machine costing, say, $130, whose estimated life is 15 years thus: $130×10=$1,300. Trace the $1,300 investment line on the graph to the 15-year oblique “life line” and drop a line from this point to the base line, where the amount $206.25 will be found. But this sum is 10 times too much, so it must be divided by 10 to show the annual estimated overhead cost; namely, $20.62.
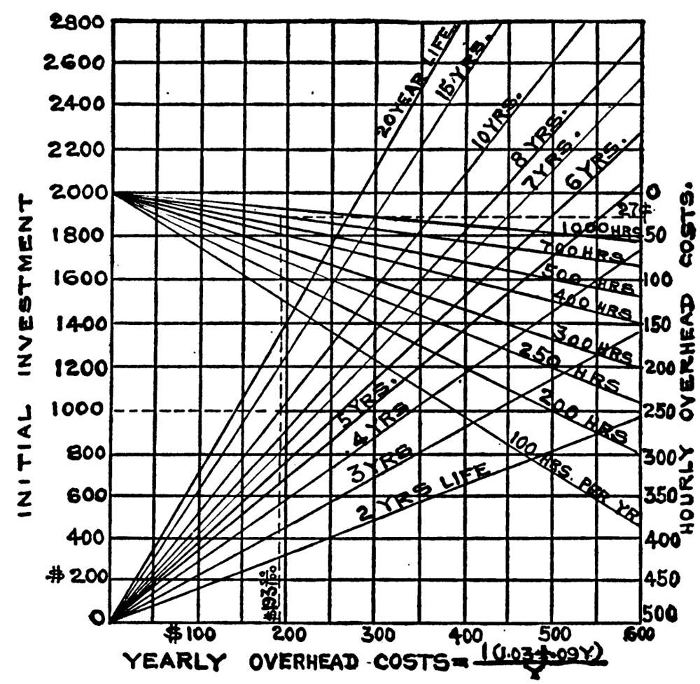
The overhead cost of tools that cost less than $20 may be made by multiplying by 100 and, after making the calculation as already explained for the $130 machine, dividing by 100.
Having determined the yearly overhead costs from the chart, follow the line upward to the “hours a year” line. Then follow a line from the intersection of these lines horizontally to the right hand margin and there read the value of hourly overhead costs.
The same answer can be obtained by dividing the yearly overhead cost by the estimated number of hours the machine is to be used during the year.
Click here to purchase Five Acres and Independence in paperback
